
NEW FOR 2022! Check out Black Friday Gym Sales 2022.
Prilepin’s Chart is a table of optimal Olympic weight lifting rep ranges to be used for training. It was created by A.S. Prilepin, a Soviet era sports scientist. The chart was created by reviewing the training journals of thousands of weightlifting athletes. It is meant to portray the optimal number of reps per set, and total rep count (volume) for power training required for the Olympic lifts (the Snatch, and Clean and Jerk). The chart, also called Prilepin’s Table, is as follows:
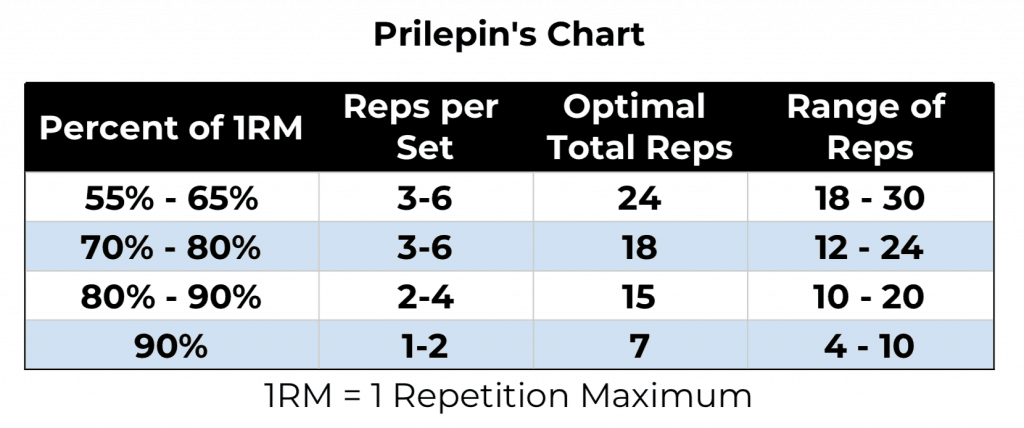
- The first column shows the training intensity – the percentage of 1RM (1 Repetition Maximum) being used.
- The second column lists the number of reps per set observed during training.
- The third column (this is the important one) lists the optimal total number of reps performed during the training session.
- The fourth column lists the total reps/set range observed.
But, before you attempt to apply these values to your training, you need to understand how this chart was developed.
Prilepin’s Chart Was Derived From Olympic Weightlifting
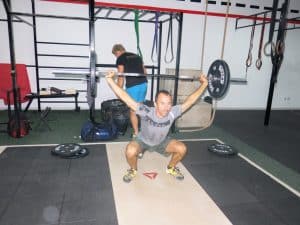
The information contained within the chart was derived through the study of Olympic weightlifting athletes. Olympic weightlifting uses power movements, not pure strength, and not hypertrophy. The Olympic lifts are defined as the snatch and clean and jerk. These so called “quick lifts” rely on power – strength delivered with the utmost in speed. There’s no way to do a slow snatch, or slow clean and jerk.
As such, be cautious when trying to apply this chart to pure strength development with other exercises, and certainly with the goal of hypertrophy.

Prilepin observed that power output and technique would suffer when trainees performed too many reps, or too many reps at too high intensity.
Likewise, if a trainee didn’t have enough volume (number of reps) or intensity, they wouldn’t perform as well either.
And that’s the basis of what the chart describes – optimal rep ranges, total volume (number of sets), and intensity (% of 1RM) for Olympic weightlifters in a single bout of training.
The Soviets dominated international weightlifting competitions in the 1970s. They took training to new heights through rigor, logic, and hard work.
With that explanation out of the way, let’s dissect the chart.
How to Interpret Prilipen’s Chart
The Percent of 1RM column represents intensity as a percentage of your 1 Rep Max (1RM) strength. We know there’s a bit of a gap in the chart … what do we do for 66%? I don’t know – I guess you should ask Prilepin. But it’s probably reasonable to assume the 65% range covers up through 69.99%.
The Reps per Set column purports to be the optimal number of repetitions per set of an exercise.
The Optimal Total Reps column is the most efficient total number of reps to perform.
Total Range is the minimum and the maximum number of total reps observed during the creation of the chart.
What does this all mean? Let’s look at an example.
If you are lifting a weight that is 60% of your 1RM, you should be using sets containing somewhere between 3 and 6 repetitions, and for a number of sets that totals 24 reps.
Whether you do 8 sets of 3 reps, or 4 sets of 6 reps, it doesn’t matter. What matters is that you total up to the optimal number of reps.
You shouldn’t lift less than 18 reps (not enough stimulus), and not more than 30 either (too much stimulus).
Another example – if you are lifting 95% of your 1RM – use sets of 1-2 reps, for a total of 7 reps, and not more than 10 total.
How Accurate Is It?
There’s some conjecture about the applicability of this chart outside of Olympic Weightlifting, and whether it applies to other exercises or not.
Here’s another concern. If it’s optimal to lift 7 repetitions total of 90% of your 1RM, should you really do the same (7 reps) with 95% of your 1RM or 98% of your 1RM? Probably not.
The really high percentages of a 1RM are very taxing on your CNS (Central Nervous System) and ability to recover.
Beyond that, the general advice given by the chart aligns well with our observations in the gym.
Overall, the chart serves as a general guide to plan your sets and reps, but don’t treat it as though it’s written in stone.
Where the Chart Falls Short
Prilepin’s Chart is not a definitive training guide.
For example, it doesn’t address frequency of workout. How often should a lifter be working at those percentages within their training cycle?
Secondly, it doesn’t address “training age”.
Should a novice lifter work with the same percentages and reps as an intermediate or advanced lifter? That question is unanswered as well. We can also assume that the trainees on which the research was based were focused solely on Olympic weightlifting. We don’t know if they had another primary sport or activity – but it’s likely they didn’t. If you are attempting to use the chart, it may not provide adequate recovery if weightlifting isn’t your only activity.
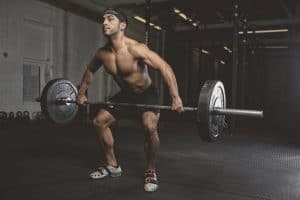
When AS Prilepin developed the chart, he was measuring maximal power output from the trainees. Power training is different than strength training. Does this chart apply to the “slow” lifts such as the deadlift, squat, and bench press? We can’t really say, the information simply isn’t there. We also know that hypertrophy training requires rep ranges much higher than what the chart proposes.
In Summary – Prilepin’s Chart
FitAtMidlife Bottom LinePrilepin’s Chart was developed by observing the training of high performing Olympic weightlifters.
It can be applied to your training. Be sure to understand what it means and how you can use it.
But you also need to understand that it is not a complete training guide. Use the information it provides to supplement your training, but be sure to understand the parts of training not addressed by the chart.
Want to learn more about Olympic weightlifting training?
You may want to review our guide to garage gym power racks, guide to ideal weightlifting barbells, or our guide to Olympic weight plates as well.
References
- Why I Don’t Use Prilepin’s Chart by Mike Tuchscherer
- Prilepin’s Chart by Justin Lascek
Photo Credits
photo credit: WODshop Power Snatch via photopin (license) photo credit: Paulo Sena IMG_4824 via photopin (license) photo credit: teamstickergiant LG Sciences via photopin (license)

Tim is the founder of FitAtMidlife.com – an avid gym rat for 30+ years, he’s a reviewer of many, many shoes – and founder of the Speed Bag Gathering – the world’s only gathering of speed bag punching enthusiasts. See more gym reviews at Tim’s YouTube channel.